Drought in Switzerland: rain is not enough
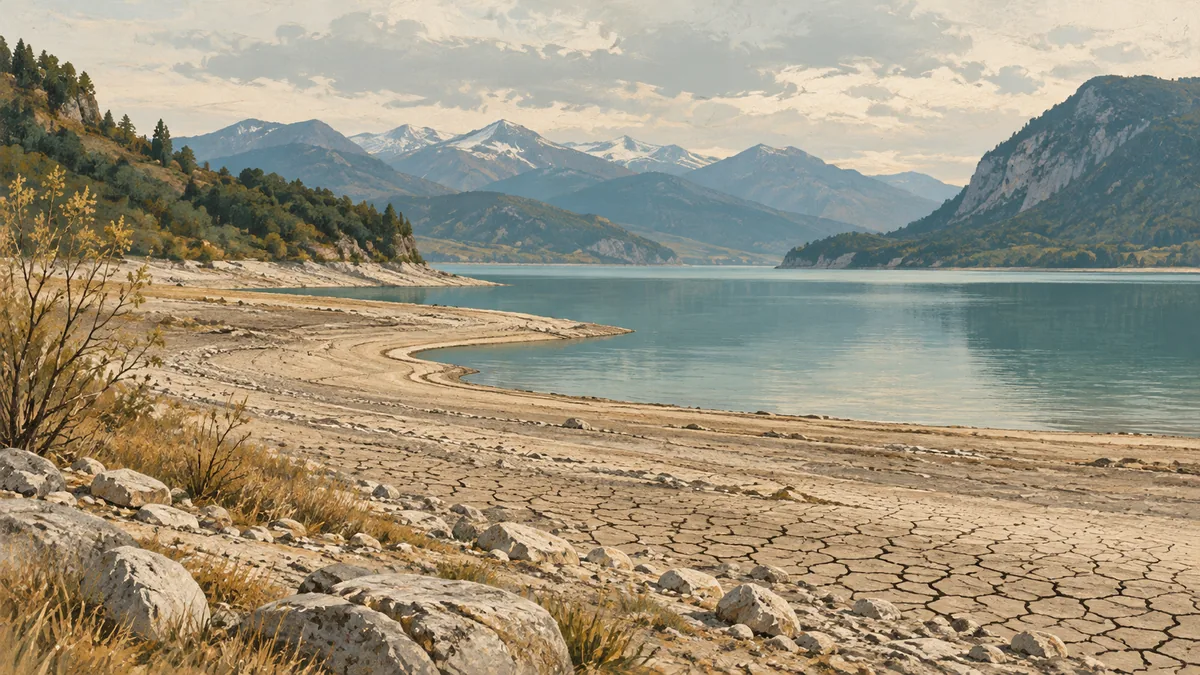
Recent rains have only temporarily alleviated the drought In the last 30 days, precipitation has been below 50% The Rhine between Lake Constance
Context
TL;DR
- Recent rainfall has only temporarily eased the drought
- Over the last 30 days, precipitation has been below 50%
- The Rhine between Lake Constance and Basel has reached record lows
- In Upper Valais, the fire risk is very high
Key facts
- Who → MeteoSwiss spokesperson, quoted by Keystone-ATS
- Period → last 30 days
- Precipitation → on average less than 50% of the long-term average
- Local values → 15-35% of the norm
- Waters → extremely low levels in the Jura and Swiss Plateau
- Discharges → statistical frequency of once every 10-30 years
- Rhine → record lows between Lake Constance and Basel
- Fire risk → high from Valais to St. Gallen; very high in some areas of Upper Valais
Over the last 30 days, drought conditions in Switzerland have remained critical, despite the rainfall in recent days. A MeteoSwiss spokesperson told Keystone-ATS that the rain had eased the problem only temporarily and that, in many parts of the country, the rainfall deficit had not changed.
The spokesperson described the overall situation as critical. The rains, therefore, did not alter the overall picture: they eased the drought only for a limited period.
“Over the last 30 days, precipitation has averaged less than 50% of the long-term average”.
The average figure should be read alongside the more pronounced local cases. The source reports that, in some cases, values of only 15-35% of the norm were recorded. The shift from the long-term average to local values shows that the precipitation did not erase the deficit described by the spokesperson.
Watercourses and lakes
In the Jura and Swiss Plateau, the levels of watercourses and lakes continue to be extremely low. At numerous measuring stations, discharges reached values that, statistically, occur only once every 10-30 years. The reference to the stations makes the picture concrete: this is not merely a general assessment of rainfall, but also measurements of discharges.
Another signal concerns the Rhine. Record lows were recorded in the stretch between Lake Constance and Basel. The source thus places the situation in the Jura and Swiss Plateau alongside that of the Rhine along a specific stretch.
Forest fire danger
Drought also affects the danger of forest fires. According to the map of the Federal Office for the Environment (UFAM), a band of high risk stretches from Valais to St. Gallen; in some areas of Upper Valais, the danger reaches the “very high” level.
Operational details
How to read drought data
The situation described is best understood by separating the precipitation data from the flow-rate data and the danger level. These are three different measures, shown in the same snapshot of the drought, but not interchangeable. For those who live or work in Switzerland, this distinction avoids using a single number to describe areas and phenomena that the source presents separately.
| Indicator | Reported data |
|---|---|
| 30-day period | precipitation averaging less than 50% of the long-term average |
| Lowest readings | values at 15-35% of the norm |
| Flow rates | values that statistically occur once every 10-30 years |
| Rhine | record lows between Lake Constance and Basel |
Average and local values
The first comparison concerns the gap between the average and the lowest readings. The 50% refers to the average precipitation over the last 30 days; the 15-35% figure instead concerns some cases. Reading the two figures as if they were the same indicator would erase the difference between the average picture and local situations. The source gives the second figure for some cases, not as a measurement referring indiscriminately to the entire country.
The reference to flow rates introduces another scale of interpretation: the source links them to the statistical frequency observed at the stations, not to the percentage of precipitation. The expression once every 10-30 years makes the assessment more severe than a simple description of the precipitation in recent days.
From the zone to the region
The map of the Federal Office for the Environment, FOEN, adds the geographical dimension. The high-risk zone crosses Switzerland from Valais to St. Gallen, while in some areas of Upper Valais the level is very high. The map does not replace the precipitation or flow-rate data: it shows another element of the situation described by the source.
For a resident, the practical consequence is to keep distinct the place where the phenomenon is observed and the type of indicator used. The text refers to many parts of the country, some cases, the Jura and the Swiss Plateau, the stretch of the Rhine between Lake Constance and Basel, and the zone from Valais to St. Gallen. A national news report therefore requires not turning a local figure into a general measure, nor considering the drought resolved simply because precipitation has fallen in recent days.
To follow the topic within the broader framework of vivere in Svizzera, it is useful to maintain this distinction between general data, local measurement and danger map.
Recommended tools
For an updated estimate, use the net salary calculator and the CHF-EUR exchange comparator.
Useful tools to protect your net income
To reduce FX leakage, compare CHF-EUR exchange options and banks for cross-border workers.
Key points
How to use the available information
To use the available information correctly, readers can follow a simple sequence. The aim is not to turn the data into a forecast, but to understand which indicator is being described and which area it concerns. The source brings together recent precipitation, watercourse and lake levels, measured flows, and a fire danger map: each step should be read within its own scope.
Reading steps
1. Start with the period. Use the last 30 days as the initial reference, because this is the interval indicated for comparing precipitation with the long-term average. 2. Separate the average from local cases. The figure averaging below 50% concerns precipitation; 15-35% describes some values equal to only that proportion of the norm. 3. Distinguish the water observed. In the Jura and on the Swiss Plateau, the source refers to extremely low levels in watercourses and lakes; at the stations, however, it refers to flow rates. 4. Check the stretch of the Rhine. The geographical reference is between Lake Constance and Basel, where record lows were recorded. 5. Read the danger map. The FOEN indicates a high-danger zone extending from Valais to St. Gallen and a very high danger level in some areas of Upper Valais.
This sequence helps keep the different aspects separate. If the text refers to recent rain, the data should be associated with the temporary nature of the easing; if it refers to flows, the statistical frequency indicated for the stations should be considered; if it refers to fires, the zone shown on the map should be examined. In this way, the reading remains faithful to the available data without replacing one indicator with another.
Reading without shortcuts
This approach helps avoid confusing a temporary improvement with the end of the critical situation. It also helps prevent automatically extending the very high level in Upper Valais to every area of Switzerland: the source places that level only in some areas and describes a high-danger zone from Valais to St. Gallen.
To connect this information to everyday life in Switzerland, you can consult costo della vita in Svizzera. To learn more about personal budgeting, use calcolatore stipendio.
Source: swissinfo.ch
Frequently Asked Questions
- Have the rains ended the drought in Switzerland?
- No. The spokesperson for MeteoSvizzera told Keystone-ATS that the precipitation in recent days has alleviated the drought only temporarily. In many parts of Switzerland, the precipitation deficit has remained unchanged. Over the past 30 days, precipitation has averaged less than 50% of the long-term average, while in some cases it has reached only 15-35% of the norm.
- Where were the lowest levels recorded?
- In the Jura and on the Plateau, extremely low levels continue to be recorded in watercourses and lakes. At numerous measuring stations, flows are so low that they statistically occur once every 10-30 years. In addition, between Lake Constance and Basel, the Rhine has recorded historic lows. These factors are part of the overall situation described as critical.
- What is the wildfire danger level?
- The hazard map of the Federal Office for the Environment, UFAM, shows a band of high hazard levels stretching across Switzerland from Valais to St. Gallen. In some areas of Upper Valais, the risk is indicated as very high. The overview also covers the risk of forest fires, which the source links to drought.